iMineralysis™: Brief Summary
iMineralysis™ is a fast, nonlinear petrophysical modeling and optimization tool designed to estimate lithology and fluid compositions in the most complex geological settings of rock and fluid properties. To download this summary as a printable brochure, click here.
Main features:
-
Accelerates the connection from log data to results.
-
Allows the estimation of the mineral coefficients (end-points) when performing multimineral analysis in areas where the coefficients are uncertain. Uses a genetic algorithm to optimize the coefficients given a possible range of values for each one.
-
Generates a multimineral solution that predicts the input logs and outputs the fractions of fluids and minerals present in the rock.
-
Automates the time-consuming, manual trial-and-error process of estimating mineral constants.
-
The increased speed allows access to new insights such as processing large data sets for rock composition, estimation of mineral constants in complex lithologies, and mapping of mineral properties (e.g., water resistivity, kerogen maturity, and clay composition)
-
Provides estimates of non-uniqueness in the lithology and fluid coefficients to help the user determine which ones need better constraints.
-
Created models closely reproduce input logs.
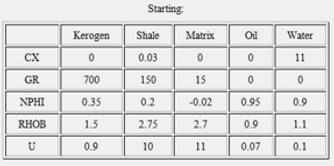
Example of the coefficient matrix showing the starting coefficient for the optimization process and the allowed ranges for each coefficient. Aggregate of minerals lumped into a single "Matrix" constituent can also be tested.


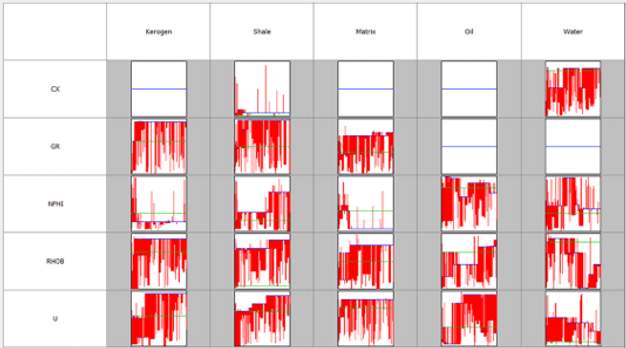
Different coefficients tested by the genetic algorithm (red) and the best solution for each iteration (blue). The initial coefficient is indicated in green. Horizontal axis is the iteration number and the vertical is the range of possible coefficients. By examining the convergence of the algorithm, the user can modify the input ranges to best honor the input data. Notice how the initial coefficient (green) is not necessarily equal to the optimal. Coefficients whose values are certain don't change during the optimization process.


Matrix of coefficients for the different constituents before (left) and after (right) optimization.

Multimineral solution performed using the optimized coefficients. Mineral solution is shown on the left, and raw data (red) vs. predicted logs (blue) is shown on the right. Different models for different geologic intervals with different compositions can be optimized simultaneously.

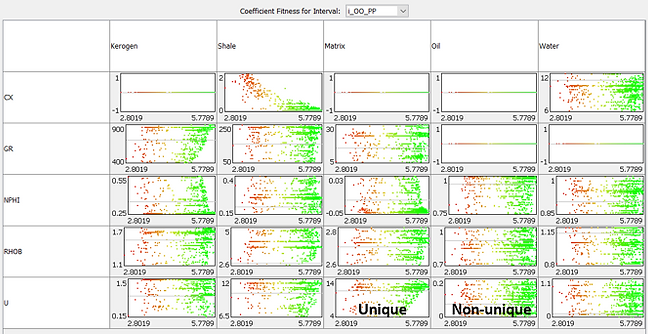
Analysis of the coefficients fitness can help to assess their non-uniqueness. Vertical axis is the coefficient range; horizontal axis is the fitness. Each dot represents a tested coefficient colored by fitness, from poor (red) to good (green). Coefficients that are non-unique require better constraints.
